\High levels of algae lead to anoxia, loss of biodiversity, invasive
species, increased occurrence of harmful bacteria, and bioaccumulation.
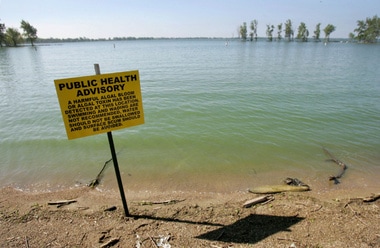
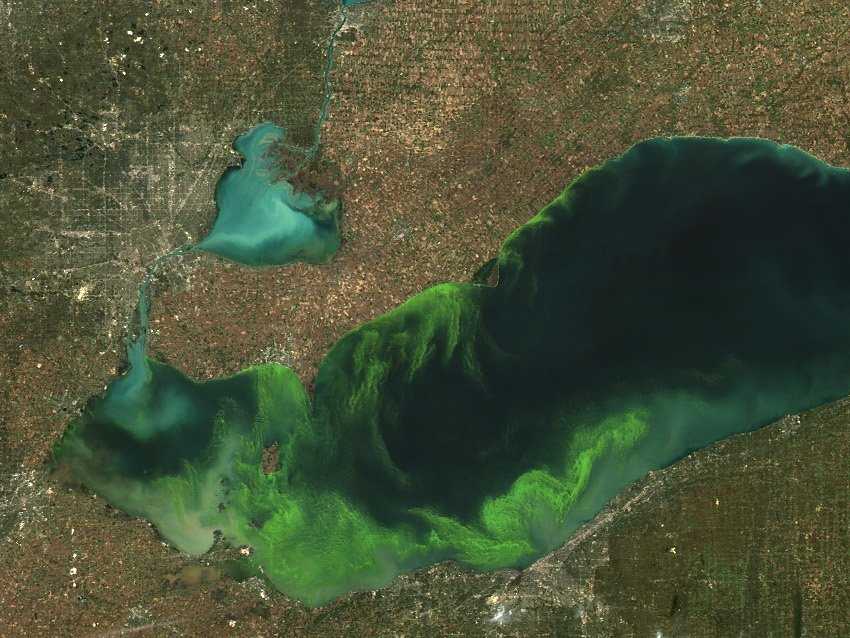
The unnatural levels of algae sequester too much oxygen when disintegrating, leading to substantially lower levels of oxygen. This is referred to anoxia or hypoxia. Hypoxic conditions are commonly referred to as 'dead zones', because there's often such low amounts of oxygen that species suffocate and die.
Not only does anoxia lower biodiversity because populations are suffocating, algal blooms negatively affect biodiversity in multiple ways. The unnatural introduction of any biomass will disrupt presently-existing ecosystems, through changes in trophic cascades and resource allocation. Other forms of plankton and algae won't have as much opportunity to flourish because the new forms of algae are taking up so much surface area, harming the food source of any species that feeds on the indigenous algae. Similarly, many species within the water rely on sunlight for warmth, so more surface cover results in cooler water. Increased algae also disrupts food chains by making it harder for birds to penetrate the surface water to catch fish.
The unnatural presence of blue-green algae in Lake Erie has been correlated to the rise in population of new invasive species, particularly the zebra mussel, Dreissenid polymorpha. This mussel species feeds off the increased algae, particularly in the western basis of the lake. Zebra mussels were introduced to Lake Erie in 1988 from industrial shipping vessels (Van Der Laar), and absorb many micro-nutrients and trace metals that otherwise would be utilized by native species (Hageman, 2017).
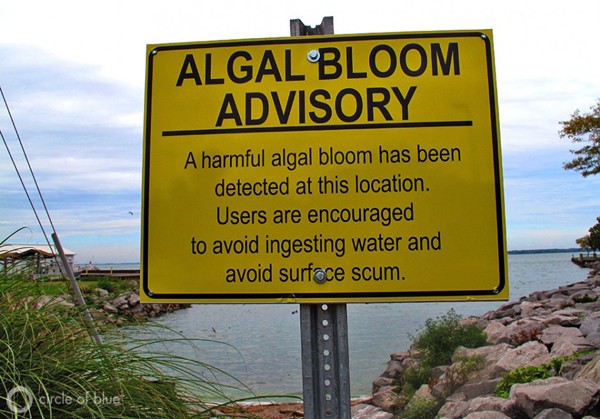
The increase in harmful levels of blue-green algae in Lake Erie has been accompanied by the increase of harmful cyanobacteria, specifically microcystin and anatoxin. Fish and smaller species may eat the algae, which contains harmful bacteria, hurting or killing many fish. Biomagnification refers to the process in which toxins or chemicals get further concentrated as you climb the food chain, as illustrated in the diagram below (fig. 1).
species, increased occurrence of harmful bacteria, and bioaccumulation.
The unnatural levels of algae sequester too much oxygen when disintegrating, leading to substantially lower levels of oxygen. This is referred to anoxia or hypoxia. Hypoxic conditions are commonly referred to as 'dead zones', because there's often such low amounts of oxygen that species suffocate and die.
Not only does anoxia lower biodiversity because populations are suffocating, algal blooms negatively affect biodiversity in multiple ways. The unnatural introduction of any biomass will disrupt presently-existing ecosystems, through changes in trophic cascades and resource allocation. Other forms of plankton and algae won't have as much opportunity to flourish because the new forms of algae are taking up so much surface area, harming the food source of any species that feeds on the indigenous algae. Similarly, many species within the water rely on sunlight for warmth, so more surface cover results in cooler water. Increased algae also disrupts food chains by making it harder for birds to penetrate the surface water to catch fish.
The unnatural presence of blue-green algae in Lake Erie has been correlated to the rise in population of new invasive species, particularly the zebra mussel, Dreissenid polymorpha. This mussel species feeds off the increased algae, particularly in the western basis of the lake. Zebra mussels were introduced to Lake Erie in 1988 from industrial shipping vessels (Van Der Laar), and absorb many micro-nutrients and trace metals that otherwise would be utilized by native species (Hageman, 2017).
The increase in harmful levels of blue-green algae in Lake Erie has been accompanied by the increase of harmful cyanobacteria, specifically microcystin and anatoxin. Fish and smaller species may eat the algae, which contains harmful bacteria, hurting or killing many fish. Biomagnification refers to the process in which toxins or chemicals get further concentrated as you climb the food chain, as illustrated in the diagram below (fig. 1).
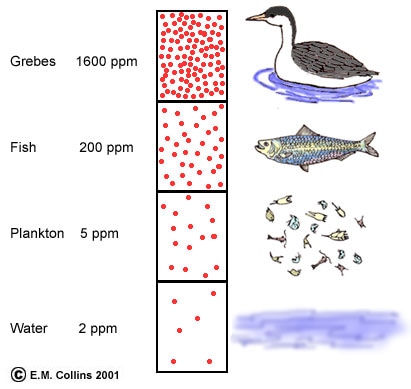
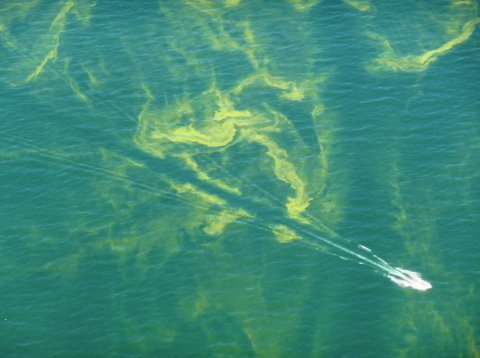
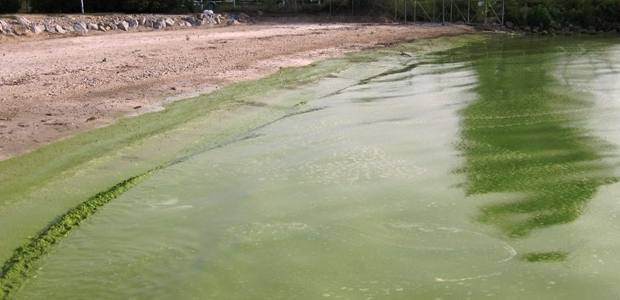
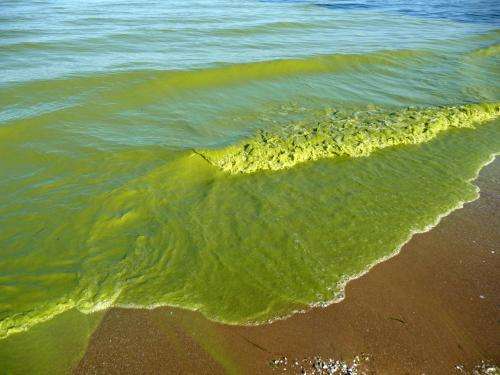
Photo Credits (from top left to bottom):
Tess Bargainnier, 2009; Tom Archer, 2009; NOAA, 3 Sep 2011; Business Insider, 2012; EcoWatch.com, 2009; W.P. Armstrong, 2017.
Tess Bargainnier, 2009; Tom Archer, 2009; NOAA, 3 Sep 2011; Business Insider, 2012; EcoWatch.com, 2009; W.P. Armstrong, 2017.
